
Abstract
Background: Recent years have seen Mendelian Randomization (MR) evolve as the next logical but intricate procedure for elucidating causality immediately after conduct or publication of a GWAS on a risk factor or outcome of interest. With a focus on the neurodegenerative disorder, through this systematic review, we hope to dissect the considerable heterogeneity in the design, conduct and reporting of the MR study. We further wish to provide a guide for conduct of an MR study citing relevant examples from literature at various stages of MR workflow.
Methods: We searched Medline, Embase, Scopus, Web of Science and databases listed in the Cochrane database for MR studies employing any of the neurodegenerative disorder as an outcome up to July 2018.
Results: A total of 30 articles investigating the causal relationship in 104 independent exposure-outcome pairs met the inclusion criteria. Majority of relationships (85.3 %) were explored using summary level data in a two-sample MR set-up. Genetic variants were prioritized most commonly from GWAS or GWAS meta-analysis, and stringent criterion of selecting the genetic variant on the basis of replication cohort was adopted in every one of ten studies. A considerable proportion of studies did not provide any reliable measure of the strength of genetic instrument (60%), and only a handful of studies defended the absence of association of pleiotropic variants with confounders of outcome (68.3%). The inverse-variance weighted method was the most commonly employed method with 58.9% analyses using multiple MR methods. However, limited efforts were made to do priori sample size estimation for desired power (16.3%).
Conclusion: Based on a small subset of MR studies available to date, we conclude that despite several promising findings, MR may still be considered at an early stage regarding its implementation and clinical application.
Keywords: Mendelian Randomization, Genome-wide association studies, Genetic Instrument, Causality, Inverse-variance weighted method, Neurodegenerative disorders
Introduction
Mendelian Randomization is believed to be a game-changer in the field of epidemiology. It is used to unearth the causal relationship between phenotypic variables by exploiting the fundamental properties of genetic variants (1). Effective implementation of this modern reinvention of the traditional concept of instrumental variables is believed to provide similar directional causal evidence as by a randomized controlled trial (RCT), had it been possible to conduct one. One or more genetic variants shown to be top hits in a genetic association study on a modifiable risk factor may be directly utilized as its naturally randomized in-born proxy marker, provided each genetic variant directly influences the outcome of interest. Thereby making it possible to test the causal association of proxy marker of a risk factor with outcome in an independent but ethically similar population also, popularly called as two-sample MR design.
Genetic associations discovered through hypothesis dependent candidate gene approach are often inconsistent and non-reproducible, thereby making way for a transition to genome-wide association studies (GWAS) in the last decade (2). With its exhaustive and unbiased coverage of the human genome, GWAS markers have also become a popular choice in MR studies. Similar to candidate gene studies, replication of discovered genetic variants in an independent cohort is also considered to be a gold-standard in GWAS studies to rule out the false positive association and could also play a crucial role in discovering true causal association in an MR study. Most importantly, one of the significant obstacles in interrogating the whole genome is the absence of knowledge on biological pathways mediated by these variants. It is entirely possible that some of these genetic variants may influence the outcome by several independent biological pathways, also termed as pleiotropic variants. The pleiotropy is also considered to be one of the major hindrances in modern MR specifically in the light of the ever increasing number of associated variants in latest updated GWAS (3).
It has now become a routine practice to merge GWAS datasets generated in independent but similar ethnic groups using a meta-analysis based approach to provide well-powered signals (4). Thereby, we have seen a recent shift in focus from utilizing the individual level genotype data to summary level effect estimates from a GWAS meta-analysis study in an MR study (5). Furthermore, large-scale GWAS datasets with individual datasets are often unavailable for public use on account of propriety, ethical and logical issues making summary level estimates as the best available option. Several new MR methods are now available to elucidate causality using summary level effect estimates including Inverse-variance weighted (IVW) method, weighted median method and MR-Eggers regression (6). These new approaches are in contrast to previously most popularly used delta method. Traditional methods involving individual-level data such as two-stage least square (TSLS), control functional estimator and limited information likelihood method (LIML) are also expected to provide a similar conclusion in the absence of correlation between genetic variants constituting a genetic instrument. With missing biological knowledge of genetic variants, the fundamental statistical distributional property of causal effect estimates of individual SNPs contributing to a single biological pathway from risk factors to the outcome is exploited to rule out pleiotropic variants. An outlier variant may thus be easily identified either by visual plots or statistical measures to test for heterogeneity in distribution. Consistent with the change in focus from individual-level data to summary level data, method to deal with heterogeneity has also changed in recent times. While Sargan’s over-identification test is recommended for use with individual-level data, Cochrane’s Q test along with the I2 test are the most preferred ones with summary level data (7). Although these post-MR approaches to detect pleiotropic variants are a critical component of an MR study, but they cannot be considered as a replacement for missing biological information on individual genetic variants.
A previous systematic review of MR studies successfully managed to shed light on the already existing plethora of methods and approaches in the implementation of MR study, during a period of predominant use of individual-level data (8). As emphasized above, a lot has changed in the manner of conduct of MR in the last three years. Furthermore, we have seen an exponential rise in MR studies. Most importantly, several articles now follow a multi-hypothesis approach involving several exposures, outcomes, and methods, with the aim of delivering a universal underlying message. Hence, necessitating a need for an updated systematic review not only with the latest developments but also using a hypothesis based approach rather than an article based approach for summarizing the results. This review would eventually provide a clearer picture of the relevance of the reported findings for clinical interpretation.
In summary, recent developments have to lead to the adoption of many workflows to prove a causal association and thereby judging the clinical relevance of an MR finding has become increasingly difficult. Most recently, we provided a comprehensive account of several possible MR workflows for both individual and summary level data along with all the recommended and sometimes necessary steps for the better conduct of an MR study (9). Through this systematic review involving a comprehensive screening of all the stages of an MR workflow using a small subset of MR studies on neurodegenerative disorders, we hope to understand practical limitations and reporting bias when MR is implemented using real-world data. We further wish to understand alternate strategies or additional methodologies that could have been employed resulting in more reliable and valid results.
Methods
The study was conducted according to the preferred reporting items for systematic reviews and meta-analysis (PRISMA) guidelines (10). The protocol of current systematic review is registered with PROSPERO (ID: CRD42018091434), and a detailed protocol was designed according to PRISMA-P guidelines and published elsewhere (11).
Results and Discussion
We identified 322 records after a systematic search of different databases. After the exclusion of duplicate studies and review of abstracts, a total of 34 neurodegenerative disorder based MR studies were identified exploring causation underlying neurodegenerative disorders employing proxy genetic variants of potentially modifiable risk factors (12-46). Full-text screening of articles further lead to the exclusion of five articles with unidentified MR methodology (32, 33, 36, 41, 46). Specifically, we observed that some of these excluded studies referred association association analysis of genetic risk scores with outcome as Mendelian randomization. We further identified additional article from the references of the shortlisted articles. Finally, 30 articles were considered for extraction of data on 95 questions relevant to methodology and clinical information as described elsewhere (11).
- Identifying the hypothesis and datasets
As a first step before plan or conduct or even interpretation of any study, it is important to state or identify the hypothesis. In order to clearly identify one or more hypothesis investigated in each study, we identified neurodegenerative disorder of interest (hereafter termed as outcome), potential risk factor (hereafter termed as exposure), prioritized list of genetic variants (hereafter termed as single genetic instrument), ethnicity, study design (including measure of risk effect), and available number of individuals. As a next step, we identified study specific phenotypic definition (hereafter termed as particular outcome), detailed characterization of exposure including any transformed or scaled values (hereafter termed as particular exposure) and method of prioritization of genetic instrument.
1.1.1 State the hypothesis
Our systematic screening of full-text articles led to the identification of 41different exposures explored for causality with seven different outcomes in more than 150,000 individuals employed on an average for each independent hypothesis. Furthermore, out of 30 screened article, 16 adapted a multi-hypothesis approach with several primary hypotheses ranging from different exposures being investigated for influence on common outcome, or several outcomes being assessed for susceptibility to common risk factor, use of different ethnic or population groups and use of different specific exposure, specific outcome and specific genetic instruments. Concerning ethnicity, all except one study hypothesis involved majorly Caucasian population. The term majorly could be attributed to the 18 study hypothesis using mixed ethnic populations to explore causality. For instance, Walter et al. explored the causal association between Alzheimers’disease (AD) and type 2 diabetes (T2D) using three different phenotypic measure of memory impairments including probable or definite late onset Alzheimers’disease (LOAD), memory score and dementia probability (45). Another study by Proitsi et al. explored the causal role of several lipid biomarkers on the late onset of the AD (40). On the other hand, Benn et al. investigated the role of common LDL cholesterol variants on several neurodegenerative disorders (28).
Since the measurement scale of exposure, as well as outcome, plays a significant role not only in the MR method applied but also the power of the study and clinical interpretation of the results, it is essential to identify the scale for both exposure and outcome relationships at the very beginning of MR study plan. On the one hand, the majority of hypotheses explored binary outcome (90.4%) with traditional belief on the presence or absence of disorders for diagnostic purposes. On the other side, the majority of exposure variables were continuous (82.8%) consistent with the predominant use of circulating biomarkers as potential risk factors. With the majority of studies employing binary outcome variables, effect measures of estimates like OR (88.2%) and RR (8.8%) were most commonly used to express the causal estimates. We observed only one study using Hazard ratio (HR) as an effect estimate. The study by Simon et al. studied the role of serum urate in the progression of neurodegeneration using PD diagnosis as the primary endpoint (37).
Furthermore, it is entirely possible that both categorical and continuous variables for the same risk factor or an outcome may have different underlying biological pathways. For instance, Cruchaga et al. explored the causal role of APOE levels on AD by using a continuous clinical dementia rating (CDR) as well as categorical clinical status suggesting presence or absence of AD as outcomes (30). Almost all the biomarkers that were continuous had to be transformed before the conduct of GWAS. Age, sex and principal components were also uniformly adjusted irrespective of exposure or outcome dataset. Specifically, GWAS on SBP was further adjusted for BMI and treatment (47). We further observed age of onset used for adjustment in PD cases compared to other neurodegenerative disorders (48). Ideally an MR study should adjust for similar confounding factors in both arms, however it is not in practical realizable. We further observed that the majority of studies failed to mention the confounding variables adjusted in the original GWAS studies. One of the reasons could be variable adjusting confounders as per the individual datasets in various populations constituting GWAS.
1.1.2 Instrument-Exposure-Outcome triad
In contrast to classical exposure-outcome association analysis for judging a potential relationship between two variables, most MR methods in an MR study utilize statistical estimates from an identical genetic instrument with exposure and outcome in different populations. Since a genetic instrument for exposure may also exhibit heterogeneity, it is crucial to recognize MR as an analysis involving three different variables: genetic Instrument, exposure, and outcome (See Figure). The study by Walter et al. utilized three independent genetic instruments from different GWAS reports (using cut-off of 5×10⁻⁸) to explore the causal role of T2D on LOAD (45). Furthermore, an individual study may follow both hypotheses free as well as hypothesis dependent approach for prioritizing genetic instrument for a potential risk factor. For instance, Benn et al. studied the role of LDL cholesterol lowering alleles (prioritized from a GWAS using a cut-off of 1×10⁻⁷) as well as a specific set of variants from PCSK9 and HMGCR variants (known to reduce the LDL levels in their cohort) on the onset of neurodegeneration (28). A study exploring role of coffee on AD selected 3 of the 10 SNPs from the original GWAS after excluding the SNPs known to be potential confounders and including other those SNPs those function was known (31). Another frequently followed approach is to further split genetic instrument based on functional subsets of SNPs or the SNPs for whom biological pathways are well known. However, we consider this step as a part of sensitivity analysis and not as an independent hypothesis. The part will be instead dealt with separately in the sensitivity analysis section. Before designing an MR study, it is further essential to correctly identify some of the additional aspects of the collected data.
1.1.3 Individual data or summary data
Raw genotype data for each SNP may be available for each individual in a population and could be used for estimating causal estimate involving appropriate handling of possible unexplained errors in the exposure or outcome arm. Recent methods have also enabled the use of summary data, i.e., regression estimates (betas) and standard errors (SEs) for the SNPs representing both the arms for calculation of causal estimates. In the current study, we observed predominant utilization of summary level with every nine of ten hypotheses relying upon already published data.
One of the advantages of having individual-level data is that it further allows one to test the MR assumptions including association analysis of genetic instrument with potential confounders without relying on an external dis-similar or small independent dataset. Furthermore, most MR methods rely on the underlying premise of the lack of correlation between genetic variants and the absence of genetic interaction, which may not be possible to test using summary level data. Moreover, availability of individual level data also provides an opportunity to perform the observational data analysis without using the genetic data. A study reported discordance between effects of BMI in 95,578 general study participants followed up for 36 years on the incidence of AD and genetically determined BMI in AD-control dataset of 54,162 individuals (24). While the observational study demonstrated an increased hazard of 32% for reduction in BMI by 1 SD, instrumental variable association analysis in the same dataset using both weighted and non-weighted genetic instruments demonstrated absence of any significant causal effect (OR=0.98, 95% CI=0.77-1.23; OR=1.01, 95% CI=0.83-1.22) .
1.1.4 Single-sample, two-sample or subsample Mendelian randomization
A study may have data on the genetic instrument, exposure, and outcome from a single population. On the other hand, data on the same genetic instrument may be available from exposure and outcome arm in entirely independent populations. It is not uncommon nowadays to find individuals finding their way in both exposure and outcome arm, hence making both the arms of MR study with partial overlap of individuals. A study exploring causal relevance of CAD for risk of LOAD expressed concerns regarding sharing of around 1000 individuals between 17004 LOAD cases and 60801 CAD cases (20). Consistent with the use of summary level data, we observed a predominance of two sample approach with 93 out of 104 MR hypothesis using independent datasets. Here, a note on precaution must be emphasized as most of the two sample studies may be slightly adultered due to partial overlap of some of the samples in both exposure and outcome populations, popularly called as sub-sample MR design. Due to the lack of transparent reporting and wrong misuse of term two-sample MR in studies, we would avoid the differentiation between the terms two-sample MR and sub-sample MR. Instead, a common term separate sample MR is will be used, as and when appropriate. An important observation in the current study was that all separate sample MR research hypothesis except five used summary level data.
With respect to the role of this aspect of study design on overall causal estimates, it has been shown that in the presence of week genetic instruments, a single sample MR may provide biased causal estimates in the direction of observational estimates due to the correlation between error terms in the observational estimates from respective associations of the genetic instrument with exposure and outcome. On the other hand, two sample MR tends to provide biased estimates in the direction of the null hypothesis.
1.1.5 Meta-analyzed datasets
Meta-analysis has always been a useful approach to increase the power of the study. Depending on the data availability irrespective of study arm, a researcher may merge datasets from different subpopulations using individual level (merging of raw genotypic data) or summary level data (merging of regression estimates of individual SNPs) or study level data (merging of causal estimates from individual studies). For instance, effect estimates for 97 prioritized genetic variants for BMI as a risk factor were based on a meta-analysis of more than 0.3 million individuals from 125 different studies (49). Another study by Pichler et al. merged delta method calculated causal estimates from three different SNPs using a meta-analysis approach to obtain a significant pooled causal association of serum iron level with the onset of PD (42). In studies employing summary estimates, most large-scale studies used estimates from meta-analyzed exposure dataset as well as meta-analyzed outcome datasets. However, such an approach comes at the cost of merging heterogeneous datasets with not only varying inclusion and exclusion criteria, quality control procedures for both genotypic and phenotypic data but also the different methods of adjusting confounding in individual datasets. Moreover, as we move towards the study level approach, we are at increased risk of suffering from weak instrument bias
1.2 Prioritizing the genetic instrument
A genetic instrument could be a single SNP or a combination of multiple SNPs which have been previously shown to be significantly associated with exposure in usually healthy controls using the self-dataset or an external dataset. We observed a single SNP marker as a proxy for individual’s years of schooling and smoking initiation based on external GWAS datasets. Two additional studies selected one out of 3 significant GWAS markers of plasma homocysteine based on a functional hypothesis for testing causal association. On the other hand, the highest numbers of prioritized SNPs were observed from LDL cholesterol and height with 380 and 697 SNPs respectively based on external GWAS dataset. We found only one study that used the internal dataset to identify the genetic marker. The study by Cruchaga et al. used APOE makers from GWAS in their dataset for the conduct of MR at a later stage using CDR as an outcome.
1.2.1 Extracting from an external or internal study
However, using a self-dataset may lead to biased estimates in the direction of observational estimates due to weak instrument bias. Furthermore, self-datasets are mostly underpowered compared to already available large-scale meta-analyzed datasets. When prioritizing genetic instrument using an external dataset, using the results from most recent and largest GWAS or meta-analysis of GWAS is considered to be the best practice. The reason for such practice is that most recent GWAS has a high probability to come out with an increased number of significant hits with a higher percentage of explained variance in the exposure and minimal study bias. For instance a GWAS on BMI in 249,796 European ancestry individuals by Speliotes et al. 2010 observed 32 SNPs reaching significant threshold which explained 1.49% variance (50). A few years later an updated GWAS in 339,224 individuals identified 97 loci reaching significant threshold and explaining upon 2.7% of BMI variance (49).
However, it is not uncommon to use GWAS employing overlapping or completely independent populations to confirm the finding. It is further recommended to use those genetic variants which have been replicated in the discovery and the replication cohort. However, this is rarely put in practice which may be attributed to unavailability of such cohorts in the original GWAS study design. A total of 41 GWAS or meta-analysis of GWAS studies on mostly different exposures (63 out of 67 exposures) with an average sample size of 140246 individuals were employed to prioritize genetic instruments. The GWAS study on lipids by Miller et al. was most commonly employed concluding causal association of lipids. One of the surprising observations was that only 9 out of 85 study hypothesis were based on the selection of genetic instruments from replication and discovery cohorts. However, one of the reasons for adopting a less popular approach of choosing genetic variants from either replication or discovery or combined cohort could be the inherent analysis conducted in the source GWAS studies. For instance, SNPs for most commonly studied lipid markers are selected on the basis of discovery cohort. Another study by Ehret al. selected genetic instruments on the basis of discovery or replication or pooled cohort. A recent study by Noyce selected on the basis of secondary analysis (23). Another striking aspect was at least 18% of studies these employed SNPs originating from multiple ethnic groups (predominantly European) with no other ethnic groups.
In summary, to date, a highly heterogeneous strategy has been adopted for prioritizing genetic variants for different risk factors. In coming years, it is further to be seen that how the updated GWAS with more number of hits will change the status of causal or non-causal associations. Loci correlation….
1.2.2 Harmonizing genetic variants across datasets
1.22.1 Directionality of effect allele in the exposure dataset
Majority of MR studies reported observational estimates in the direction of increase in effect per allele (48/57).
1.2.2.1 Matching of genetic variants
One of the pre-requisites for calculation of causal effect estimates in an MR study is that effect estimates from genetic association analysis of risk factor should all be in the same direction. This condition may result in modification of allele of interest as reported in the original study or analysis for the respective SNPs to be altered. As a next step, the SNPids should be synchronized with the SNPids from the dataset on the outcome variable.
1.2.2.3 Search for single nucleotide polymorphisms in linkage disequilibrium
It may be noted that SNPids in the outcome dataset may not be necessarily associated with outcome and hence often may be unavailable in published datasets. As and when SNP ids in the outcome dataset are not available, a suitable proxy SNPs may then be employed using a pre-specified LD cut-off with a minimum interSNP distance (>5kb). Although recommended cut-off is 0.9 with several studies employing 0.8, we observed flexibility shown by some studies which may or may not be supported by suitable sensitivity analysis. For instance, a study utilizing three genetic variants to explore role of coffee on AD used a proxy SNP with an LD of 0.694 and further went on to conclude with effect estimates (31). Another study repeated the analysis at a later stage and reported OR of using the same datasets however with five independent SNPs reported suggestive causal association (17).
Several strategies have been followed to check LD between genetic variants, one may use the original GWAS datasets to check the LD, or one may use an online database with 1000 Genome database or similar, or one may use self-dataset. Although original GWAS studies remove high LD SNPs, Majority of reports used their individual-level data to check LD among SNPs. A small proportion of studies relied upon online databases to demonstrate the absence of LD between SNPs. It is recommended to use a combinatorial approach as each database represents often a small number of individuals belonging to specific ethnic groups.
However, the possibility of proxy SNPs with high LD showing association with outcome in reverse directions cannot be ruled out, thereby necessitating a sensitivity analysis. We will be dealing further with this issue in the section on sensitivity analysis. Availability of proxy SNP is dependent upon the coverage of genome by the chip employed in the outcome study. Henceforth, quite often the proxy SNP is not available. Although, we observed that the proportion of proxy SNPs employed was not considerably high, it could still have a significant influence on study results. On one side, the absence of proxy SNPs for SNPs explaining a large proportion of exposure variable could lead to the weakening of the genetic instrument. In such a scenario, we recommend reporting of missing SNPs along with the loss of variance explained by genetic instrument due to their absence. On the other side, the absence of proxy SNP for a SNP what may have been strongly associated with outcome could severely bias the results. Again, in such a scenario, we recommend reporting of missing SNPs along with their relevant biological link with the outcome to rule out any potential bias.
1.2.2.4 Matching of alleles of respective genetic variants
Aligning SNPs with A/T and C/G polymorphisms is a common known problem known to geneticists in the absence of strand information specifically when MAF is low. We failed to observe any such information in the manuscripts on the strategy followed to align such SNPs. However since most of studies report their results for forward strand, it is supposed to be taken care of automatically. However special care must be taken when aligning proxy SNPs as the polymorphism type of proxy variant could be different from the aligned variant. It was not clear if any SNPs were dropped on the basis of palindromic variants. In such a scenario providing and checking of MAF of SNPs not only assure about expected allele frequency of ethnic group under study but also the correct allele.
Imputation is nowadays become a standard approach in GWAS studies as it leads to improved coverage with high accuracy. In this regards, it may be relevant that source population used for imputation could have profound influence on imputation quality. It is quite possible that GWAS studies may not report imputation quality for the reported SNPs, often making it difficult to test the reliability of effect estimates. Furthermore, the inclusion of individuals in an MR study with missing information of more than 2 SNPs is recommended. Since most of the studies used summary data, we expect that this issue was not encountered in any of the datasets since imputation is now-days a general rule before proceeding with GWAS study.
1.2.2.5 Assumption of genetic model
Since genetic model is rarely find its mention in an MR manuscript, we assume that none of the MR studies followed a non-additive genetic model as we did not find any details on genetic model in any of the manuscript.
1.2.2.6 A priori power calculations
Variance of the available genetic instrument is one of the key determinants of required sample size at a given power for rejecting the hypothesis of absence of causal effect. Harmonization of genetic instruments may lead to dropping of few genetic variants due to their unavailability or their proxy in the outcome dataset. This may result in reduced variance explained by the finalized genetic instrument in comparison to the genetic instrument extracted from original GWAS on exposure dataset. In addition, as variance for a binary exposure cannot be determined, several statistical methods can be used to determine the pseudo variance that could be further used to compute required sample size. Furthermore, as the sample sizes are often fixed at the start of two sample MR study using summary effect estimates, an a priori power analysis could help us determine effects sizes that could be powerfully determined based on given proportion of cases and controls in the outcome dataset.
We observed only 17 MR analysis spanning 7 out of 36 manuscripts reporting or mentioning power calculations in their manuscript. A recent study exploring causal role of combined PCSK9 and HMGCR variants on various types of dementia reported absence of causal association with post hoc power ranging from 3.8 to 24% (28). Another study reported expected range of OR for observing >99% power but failed to observe any OR lying in the range (40). Similarly, a post hoc power analysis by Grace et al. reported a power of 83.57% to detect a 7% effect of outcome with the study using a 5% FDR threshold. Another study exploring role of genetically elevated gamma-glutamyltransferase on AD reported a power of 82% to detect an OR greater than or equal to 1.2 per 1SD of CGT with study itself reporting a lack of causal association at an OR of 1.09 (20). Similarly another study reported a required OR of 0.90 or 1.12 for sufficient power (13). Absence of transparent reporting of power analysis was observed in majority of reports. In general majority of studies reporting power analysis lacked sufficient power.
1.2.2.7 Calculating a weighted or unweighted genetic score
Availability of individual level data allows one to merge the risk conferred by all genetic variants in a genetic instrument into a genetic score for each individual. One may computed a weighted score by taking into account effect estimates of each individual SNP with exposure in an external dataset using for prioritizing the variants or the same dataset. We observed as many as 36 studies employing genetic risk scores. Consistency between weighted and unweighted effect of individual SNPs could be implemented both at individual level MR as well as summary level MR. In individual level MR, one may generate weighted and unweighted GRS in each individual. For instance, two independent studies exploring causal role of BMI and APOE alleles in AD demonstrated risky and protective and risky role respectively using a 2-stage instrumental variable analysis approach. Both the studies used weighted as well as unweighted allele scores to demonstrate consistency in the directionality of causation (21, 24). Among the studies using summary level estimates, in general we did not observe any study adopting non weighted strategy while computing causal effect estimates. In summary, summary level data employed only weight; most individual level data followed a more conservative approach.
1.3 Validating the genetic instrument
1.3.1 Strength of genetic instrument
The strength of a genetic instrument is a critical step to judge the validity of first assumption of MR. One of the important strength of merging several SNPs into a score or genetic instruments increases the strength of genetic instrument. Such an approach helps in overcoming limitations of limited power with a single SNP as each single SNP explains little variance in the exposure dataset. With the context of Mendelian randomization, F-statistics may be considered a better measure as it incorporates sample size of exposure dataset as well as number of SNPs in the genetic instrument. A large number of studies reported both F-statistics and R2.We observed a correlation between some variants prioritized and the amount of variance explained. 0.022 to 14.0. Only a handful of studies explained the variance; we have to get back to original GWAS to trace the variance. A study exploring role of serum iron levels on PD reported F-statistics of three independent variants representing genetic instrument explaining 4.3% variance of total iron variance was 382, 199 and 379 (42). The F-statistics of the combined genetic instrument was 987 and the authors attributed high F-statistics to a sample size of more than 21,000 individuals’ data in whom iron levels were measured. The combined MR estimate showed a significant protective effect of iron compared to non-significant effect causal effect observed with individual variants. This approach is in sharp contrast to recent study concluding protective causal association of year of education with AD using a genetic instrument comprising of 152 SNPs with an F-statistics of 5.7 (n=405072, r2=1.6). As many as 49 studies failed to report either F statistics or R2. The under-reporting of variance explained by instrument although may partially be attributed to categorical exposure variable with 11 of the 49 results. In general, traditionally recommended F-statistics of greater than 10 often reported in literature as a thumb rule may not be strictly followed, although a low variance could influence the power of the study.
1.3.2 Association analysis with confounders and existence of pleiotropic pathways
Often the remaining two critical assumptions of MR are overlapping and merged, when it comes to judging the validity. We decided to treat them as one assumption and the approach involves use of both theoretical as well as fact based approach. To test these assumptions, one may use self-dataset, independent dataset, and online available information or judge the assumptions based on experimental literature or clinical experience.We did not find any association analysis of SNPs or genetic instruments in 69 MR analysis, 34 used their own dataset and only 2 used literature search approach.Walter et al. tested for presence of confounding in the association analysis of genetic instrument for type 2 diabetes with AD by conducting association analysis of genetic risk score comprised of 39 genetic variants with sex, age, HbA1c, high density lipoprotein and total cholesterol in an independent cohort of upto 8501 individuals belonging to HRS cohort (45). On the other hand, Benn et al. exploring causal role of LDL cholesterol on AD and PD in prospectively followed up 111194 Danish general population tested the existence of confounding by not only testing association of genetic instrument but also the LDL cholesterol with age, sex, hypertension, smoking, physical activity, alcohol consumption, education and menopausal status in women (28). Evidently, there are no clearly defined confounders when testing association of genetic instruments in individual level data. Nevertheless age and sex considered as universal confounders were consistently tested for association with genetic instruments.Another powerful approach could be use already available online GWAS catalogues to check whether any of the SNPs in the genetic instrument has been previously reported for association with potential confounders. An exhaustive approach was adopted by a Mokry et al. exploring causal role of Vitamin D with MS (34). The study not only tested involvement of of SNPs constituting genetic instruments using individual level data in biological pathways like sun exposure, time outside, physical activity, oily fish consumption, smoking, alcohol consumption, BMI, abdominal obesity and social class but also did a systematic online search of SNPs as well as gene name, gene mutation and protein name for potential pleiotropic biological pathways. The systemic search further concluded that Vitamin-D related genes have often been associated with other clinical phenotypes such as colorectal cancer and inflammatory airway conditions however these were considered unrelated to MS and autoimmunity. In summary, we observed under-testing of a critical assumption of Mendelian randomization. Our findings further stresses upon the need for developing a consensus in defining confounders for respective association analysis.
1.4 Estimation of causal effect
There are several MR methods to estimate causal effect which is largely dependent upon several factors including availability of genotype data, number of SNPs in the genetic instrument, proportion of pleiotropic variants in the genetic instruments, correlation between SNPs within and among multiple exposures and degree of overlap of individuals among exposure and outcome datasets. Traditionally, TSLS and IVW methods are considered as gold standard using individual and summary level data.
Consistent with change in focus from individual to summary level data, we observed only four studies employing TSLS method. We further observed four additional studies using GMM approach. Although IVW is a predominant method employing summary level data with representation in all the studies, recent years have further seen evolution of improved adaption of IVW method such as using second order weights and random effect model. For instance, we observed two studies employing IVW method using random effect model in addition to traditional fixed effect model in MR studies (34, 40). Furthermore, MR-Egger method and weighted median were used as additional methods in 41 and 46 MR analyses compared to 79 analyses in general employing IVW method. We further observed use of penalized weighted median method in 24 MR analyses. These additional methods are further considered to be methods of sensitivity analysis and have been further discussed in the section on sensitivity analyses. Although multivariable MR is one of the popular approaches to deal with the issue of correlated continuous exposures, we observed only one out of six studies employing multiple exposures using multivariable MR to judge causality (27). In summary, additional adaptations of IVW method and methods to deal with correlated exposures were under-represented in MR studies on neurodegenerative disorders.
1.5 Detection of pleiotropy and sensitivity analysis
There are several approaches to detect, report and adjust for potential pleiotropy. We broadly categorize these approaches into statistical measures, consistency analysis, graphical methods and sensitivity analysis. In general, a significant statistical measure of heterogeneity or lack of consistency in causal estimates using different MR methods may suggest presence of outlier which may also be detected in appropriate graphical method whose influence on overall result may be further checked using an appropriate sensitivity analysis. Furthermore, it is quite possible that a number of pleiotropic variants may go undetected in statistical methods to detect heterogeneity and may require additional sensitivity analysis based on biological reasoning. In such a scenario, a subgroup analysis based on their known functional pathways from outcome from exposure may be conducted.
As a note of precaution, we define sensitivity analysis as an approach that tends to check existence of potential pleiotropic variants. This is in contrast to sub-group analyses based on different populations which may be considered as an independent MR analysis. Another important point of consideration is that some studies tend to remove such pleiotropic variants at the start of their study; others prefer to do a sensitivity analysis, before withdrawing conclusion
1.5.1 Statistical methods
In consistent with the use of summary level data, we found use of Cochrane Q statistics, I2 and MR-egger test to detect heterogeneity. Surprisingly, majority of MR analyses (35 out of 91) used underpowered MR-egger’s intercept test to test for heterogeneity. This is in sharp contrast to only 13 and 11 analyses mentioning Cochrane Q statistics and I2 to detect pleiotropy. We did not find any study reporting significant heterogeneity for any of the explored outcome-exposure relationships. Our observation necessitates the need for creating awareness for better understanding of tools for reporting heterogeneity.
1.5.2 Consistency based methods
1.5.2.1 Consistency across MR methods
In recent years, we have seen development of several new summary based MR methods to provide reliable estimates in the presence of potential pleiotropy. A consistency in directionality of association signals across multiple MR methods is further believed to providing an affirmation of causality. We observed that a combination of IVW (fixed), MR-Egger and weighted median method was the most commonly adopted approach in analyses using multiple MR-methods (41 out of 56). For instance, Larsson et al. in his two separate hypotheses exploring causal role of height and branched chain amino acids on AD demonstrated consistency in risky and protective causal role with IVW and weighted median methods (12, 18). The highly conservative MR-egger method on the other hand failed to yield suggestive associations with both the exposures. A small proportion of these MR analyses were further supported by penalized weighted median (24 of 41). On the other hand, we observed a single study employing multiple MR methods to interrogate causality using individual level data. The study by Cruchaga et al. confirmed causality of APOE levels with CSF Aβ42 levels using two stage least square regression (2SLS) and limited information maximum likelihood method (LIML) in 570 individuals with AD (30). In summary, although such an approach is now more or less universally adopted in majority of recent manuscripts using summary statistics, IVW method appears to be the method of choice when deriving conclusion in an MR study. However, different MR methods have different power to detect causation which must be taken into account before drawing relevant conclusion and each method may be relevant for different causal pathways due to differential sensitivity to extent and direction of pleiotropic variants. Our further attempt to judge consistency in the reported effect estimates using different methods were hampered due to lack of availability of results employing different MR methods.
1.5.2.2 Comparison of results with different genetic risk scores
Causal estimates in an MR study may also be computed by considering weighted and unweighted effect of individual SNPs. An inconsistency could well be an indication of presence of pleiotropic variant. On the other side, consistency could add credibility to the findings. A study in 95,578 Danish individuals demonstrated lack of causal effect of BMI on AD using both weighted allele score and simple allele score (24). Another study in the same population demonstrated genetically determined lower plasma APOE in patients with AD as well as dementia using both weighted allele and simple allele scores (21). The consistency in the associations reported in the above studies demonstrates utility of different methods of computing genetic risk scores in making relevant interpretations. In summary 64% of MR analyses reported either heterogeneity statistics or used multiple MR methods to check the issue of pleiotropy.
1.5.2.3 Consistency of observational and causal estimates
We define an observational study as a study directly exploring association analysis between exposure and outcome without use of any additional information from genetic variants. Studies involving use of genetic variants could be a simple genetic association study between genetic variants used as proxy of exposures with outcome of interest or a Mendelian randomization study.
Every one in four studies further conducted an observational study to supplement their MR findings. Walter et al. 2016 and Protitis et al. 2014 used independent datasets for their observational analyses in smaller cohorts of 8403 (health recruitment study) and 423 (AddNeuroMed) individuals compared to MR study involving up to 131300 and 199156 individuals of Euroepean ancestry (40, 45). Walter et al. reported a confounded observation association of T2D with lower memory score and higher log odds of dementia, On the other hand, Proititis et al. reported absence of association of serum lipids with increased risk of LOAD using the observational data. In contrast, both the studies further failed to observe any causal role of T2D and Lipids on predisposition to AD.
Three independent MR reports further reported their observational and MR findings by using the same overlapping individual level dataset of up to 111194 individuals in the Danish general population. Observational analysis by Nordestgaard et al. 2017 demonstrated increased risk of AD with stepwise decrease in BMI (24). Similarly, Rasmussen et al. 2017 demonstrated increased risk of dementia with a stepwise decrease in ApoE (21). On the other hand increase risk of AD with LDL was reported by Benn et al. only with an increase in LDL within lower LDL cholesterol range (28). Lifelong changes in BMI and low LDL levels however didn’t show any causal association with dementia compared to detection of causal role of Plasma APOE. Another study further explored role of CSF APOE on CSFAβ42, known to be correlated with number of plaques in brain (30). Cruchaga et al. was also able to show replication of causal role of CSF APOE protein levels in determining CSF Aβ 42 levels using both confounded observational and unconfounded MR analysis. The study further demonstrated retention of observational association even after adjusting for genetic instrument used in the MR analysis.
Most recently Policicchio et al. adopted a comprehensive approach by conducting a large sacle meta-analysis of observational studies of RA with AD using 6346 individuals and compared with results with an MR study using summary effects estimates using 122,022 individuals. In summary, MR study lead to several conclusions which were contradictory to popular belief from observational studies. The advent of Mendelian Randomization study henceforth raises an important question on utility of observational studies and genetic association studies which have been used to answer several important clinical questions of interest in the past. Furthermore, failure to observe similarity in direction between well powered observational studies and underpowered Mendelian randomization with often hidden pleiotropic variants may further add confusion in the minds of clinicians.
1.5.2.4 Consistency of individual level and summary level MR estimates
Replicating same results by using both individual level data and summary level data may further increase reliability of observed causal association. A study exploring role of lipids in the predisposition to late onset Alzheimer’s disease (LOAD) demonstrated absence of causal association of each of the inversely transformed lipid trait (HDL-c, LDL-c, TC and TG) in 10,578 Europeans with availability of effect estimates on LOAD status. The absence of causation was further confirmed using individual level data in 550 Europeans with data on lipid levels, individual genotypes and LOAD status (40). Another study demonstrated absence of causal association using individual level data as well as IVW estimates using summary level estimates in independent ethnically similar European populations (24). In summary, readily available summary level data has suppressed the importance of individual level data. The possibility of individual level data as a more powerful and reliable approach using complete information on individuals and confounding variables to detect causality cannot be ignored.
1.5.2.5 Consistency in MR estimates using unique loci when studying multiple exposures
It is quite possible multiple correlated exposures lead to the same outcome. Since most available genetic instruments explain only a proportion of phenotypic variance in the exposure dataset, it is quite possible that phenotypic correlation might not be reflected in genetic correlation among genetic instruments representing different exposures. Another important point of consideration is that probability of high correlation between genetic instrument increases markedly when multiple GWAS on correlated exposures are available in the same population.
Blood pressure parameters (SBP and DBP) are amongst the highest correlated phenotypic traits. Other examples of highly correlated traits include traits representing Lipids (LDL, HDL, and TGL), glycemic traits (fasting glucose, fasting insulin, HbA1c) and anthropometric traits (WHR, BMI, Birth weight, Height). The degree of overlap between genetic instruments within each set of correlated phenotypic traits is one of contentious issues as overlapping variants could represent pleiotropic variants. . Furthermore, even the traits within each category may be correlated across the functional categories. Although several studies explored multiple correlated exposures, only few studies decided to handle the issue in a systematic manner. Several strategies could be adopted to deal with highly correlated instruments. If number of overlapping loci between correlated phenotypes is not high representing only a small proportion of shared variance, best approach would be to conduct MR of correlated exposures after removing overlapping SNPs. Study by priortis conducted MR analysis by constructing both full traits GRS as well as trait specific GRS (40). Expectedly using trait specific GRS would considerably reduce the F-statistics of the genetic instrument and loss of power to detect association. Another approach could be the use of highly conservative multivariable MR. The approach allows one to use all the SNPs however at the cost of considerable reduction of power with multivariable regression and inability to incorporate categorical exposure variables. Burgess and Smith et al. using same three continuous traits (HDL, LDL and TG) explored association with AMD using both univariable and multivariable MR (27). Recently several new methods have evolved to dissect causality from correlation and could provide a better approach to dealing with contentious issues of correlated genetic instruments and exposure variables.
1.5.3 Graphical methods
Funnel plots are one of the most important methods to detect outlier variants. Surprisingly, we observed only six MR analyses accompanied by funnel plot with none discovering pleiotropic variants through the method. Another recommended approach could be graphical visualization of leave one out analysis. Although a handful of studies did use forest plots of individual SNP level causal estimates and scatter plots of effect estimates with exposure and outcome, but they were rarely used to detect or show outliers.
1.5.4 Sensitivity analysis
Sensitivity analysis has been defined in the MR literature in various ways. For instance, Devorak et al. defined sensitivity analysis as exclusion of SNP shown to be violating any of the MR assumptions (51).
1.5.4.1 Leave one SNP out
Single SNP exclusion method is clearly one of the most consistent methods reported by almost all the MR analysis with 4 out of every 10 analyses reporting it or showing a forest plot for MR analysis.
1.5.4.2 Leave pleiotropic variants out
The method also takes into account exclusion of pleiotropic or outlier variants detected by various plotting methods. However, this approach is different from collective removal of all the pleiotropic variants. Unexpectedly, we did not find many studies using funnel plot. We find not many studies reporting detection of outlier SNPs through funnel plot. To some extent, reason could be absence of association or limited number of figures to be reported in the manuscript.
1.5.4.3 Grouping of functional categories
Another approach that was reported by at least three different reports was functional categorization of SNPs reported in the original GWAS and computing functional pathway specific causal estimates. Walter et al. computed four different genetic risk scores for various biological pathways related to diabetes (adiposity-related, beta-cell function, insulin related and other biological factors) (45). Mukherjee et al. further identified computed four different sub score specific estimates after partitioning BMI related variants into adipogenesis, appetite, cardiopulmonary factors and other biological factors (44). Both the studies further conducted an over-identification test to check consistency in estimates across different pathways. Another study reported two mechanism specific scores for genetic instrument representing Vitamin D metabolism and synthesis respectively (34). Such an approach may be considered as more of an exploratory analysis due to often underpowered and theoretical subgrouping of SNPs.
1.5.4.4 Leave variants associated with potential confounders
Another approach was to do exclusion of variants reported in literature for their association with potential confounders. In general, most studies tend to handle such SNPs as a part of sensitivity analysis; some followed a more conservative approach by excluding them at the stage of prioritization of genetic instruments. For instance, a study exploring role of genetic instruments representing coffee exposure excluded 4 out of 9 SNPs from the genetic instrument for their involvement in body weight or lipids identified using Ensemble’s phenotype database (31). The study concluded absence of any causal role of coffee drinking on AD. Another study using GWAS central removed a large proportion of SNPs from an initial genetic instrument comprising of 960 clumped variants representing LDL cholesterol to the final instrument comprising of 380 independent variants with no previous reported association with confounding phenotypes (28).
Few studies rather relied on biological pathway based knowledge of the gene to carry out sensitivity analysis. Out of four SNPs representing Vitamin D, one SNP is known to be present in a gene encoding vitamin D binding protein (GC). The study by Mokry et al. conducted sensitivity analysis by excluding the variant. The study justified their exclusion on the basis of potential role of the gene to influence outcome phenotypes independent of Vitamin D. The study further showed no influence of removal of SNP in the protective causal role of vitamin D on MS. Another study suspected rs12922396 within CDHI3 gene as a part of genetic instrument representing Adiponectin for direct involvement in pathogenesis of MS (29). This approach is in contrast to approach adopted by Romo et al. who relied on underpowered MR-egger approach to draw conclusions on association of circulating lipid levels with AD despite the presence of a highly pleiotropic variant (rs780093 from GCKR) with functional role detected in multiple biological pathways. The gene function based approach may become more complex to deal with when we have a large number of genetic variants. Benn et al. relied on MR-Egger approach to draw conclusion on causality using 380 LDL variants low LDL cholesterol showing a causal risk ratio of 0.64 (95% CI=0.52-0.79). Another study used MR-Egger approach to support loss of association of a single pleiotropic variant that explained heterogeneity in the overall results in its presence(20). Using all the 52 genetic variants representing CAD, the study showed a significant causal association of CAD with AD with IVW method and non-significant association with MR-Egger method. The study reported MR-Egger as the method to report causal analysis. Another study while exploring role of 5 variants could not conclude presence of pleiotropy despite significant variation in the effect of removal of single genetic variant in leave one out analysis on the overall effect estimate. The issue is still debatable whether a genetic instrument should be analyzed as a whole followed by sensitivity analyses as well as suitable adjusted analysis or the variants should be removed at the start of the study. The method of sensitivity analysis could be determined by number of SNPs, power of the study and funnel plot.
1.5.4.5 Iteration based approach
Random exclusion of a small proportion of SNPs in the genetic instrument using iteration based approach and judging consistency in point causal estimates or its CI is another possible approach to check influence of potential pleiotropy. This approach could in fact address the issue of cumulative effect of several pleiotropic variants as pleiotropic effect of single variant acting on its own may go undetected. Burgess and Smith et al. demonstrated high reliability in their causal estimates of HDL cholesterol with AMD with 96% of one million iterations (each iteration was defined as a random exclusion of 30% variants) resulting in positive estimates (27). On the other hand, Polichcchio et al. demonstrated stability in absence of protective role of RA in AD with 0.009% of 0.1 million iterations (each iteration was defined as random exclusion of 20% variants) resulting in point estimates lying outside the 95% CI of IVW estimates predicted using the complete genetic instrument (15). This approach could be a powerful approach when number of variants in a genetic instrument is sufficiently large enough. However, the collective number of SNPs to be excluded at each iteration appears to be an arbitrary guess on the potential number of pleiotropic variants in a genetic instruments and a theoretical justification might be difficult.
1.5.4.6 Exclusion of SNPs associated with outcome
Another important approach could be exclusion of outcome associated SNPs as such SNPs might be directly influencing the outcome. For instance, it’s a common approach to exclude APOE variants from the genetic instruments for exposure when studying causal association analysis with AD. A study exploring role of lipids on AD excluded rs4420638 within the APOE locus before the start of the study (40). Another study judging causal association of several modifiable risk factors with AD followed a more systematic approach further by excluding variants with a more significant association with AD than expected by chance (0.05/number of non-overlapping SNPs among different modifiable traits) (43). The study using the dataset for lipids and AD identified another group of outlier variants rs6857 near APOE and rs1883025 near ABCA1 gene as an outlier based on association with AD at a significance level beyond that expected by chance. Still another study using the same datasets omitted only the rs1001949 APOE variant, which was identified as an outlier in the quantile-quantile plot of chi-square statistics for associations of lipids with AD (27). We not only identified heterogeneity in the identification of outlier variants but also non-uniformly concept when studying different outcomes in which variants other than APOE may have a direct role on the outcome. Furthermore, current approach has been mostly adopted at the start of the causal analysis and may not be always conducted as a part of sensitivity analysis. Again, the pre and post exclusion of SNPs is open to debate.
1.5.4.7 Exclusion of proxy SNPs
It is quite possible that a proxy SNP with an imperfect LD with the original SNP may have a completely different effect on outcome to the extent of reversal in direction of effect estimate. In such a scenario, exclusion of proxy SNPs may provide influence of any such potential bias. We found only two studies following this approach. A study by Devorak et al. 2016 demonstrated no influence on overall absence of causal association of adiponectin levels with MS after exclusion of six proxy variants out of a genetic instrument comprising of 10 SNPs (29).Another study by Mokry et al. reported a stronger relationship between obesity and MS after removal of proxy SNPs (16). However, the stronger relationship disappeared after exclusion of only a subset of proxy variants with allele frequencies between 0.4 and 0.6. The method of checking proxy variants could be more important both original variants (i.e. unavailable variant) and the proxy variant are palindromic variants.
1.5.4.8 Exclusion of palindromic variants
A less stringent approach could be to check the influence of palindromic variants with allele frequency between 0.4 and 0.6, since palindromic variants are likely to influence by not only flip in allele frequency between exposure and outcome dataset but also the flip in strands. We did not observe any study reporting the issue of palindromic variants. In summary, reporting of handling of issue of palindromic variants could add confidence to results, specifically when number of variants in a genetic instrument is relatively small.
1.5.4.9 Exclusion of SNPs affected by population stratification
We observed several of the populations used in MR are often majorly European with some trans-ethnic component. It may be further possible that some of the cohorts included by large meta-analytic GWAS studies (exposure or outcome) may have failed to adequately adjust for population stratification. For instance, study by Pichler conducted a sensitivity analyses by exclusion of subpopulations in PD dataset not adjusting for population stratification (42). Another approach could be excluding SNPs known to show variation among different ethnic groups specifically when differential prevalence of exposure or outcome is well known among worldwide populations. Mokry et al. showed that one of the four SNPs representing genetic instrument for Vitamin D (rs12675878 from DHCR7) was strongly associated in one of their European status in CaMos cohort used for generation of effect estimates in exposure dataset (34). Devorak et al. further showed that exposure levels did not vary among European subpopulations (29). In summary, majority of MR studies reported their results assuming that issue of population stratification has already been addressed in the original GWAS of exposures and outcomes.
In summary, there are large numbers of methods to check the existence of potential pleiotropy. Although some methods may be data dependent, other methods have been inconsistently applied across different investigations. On the other hands, conducting an observational study and bidirectional analysis may be subjected to availability of datasets. Iterationbased methods may provide a powerful method to check the reliability of estimates.
1.6 Additional considerations
1.6.1 Reporting of corrected p-value
We observed a total of 13 out of 30 studies following a multiple-hypothesis based approach. The hypothesis could involve use on independent genetic instrument, exposure or outcome. On one side, studies observing no association refrained from applying any corrections. On other side, we observed as many as 60 out of the remaining 74 studies reporting corrected P-values.
1.6.2 Reporting of units of effect estimates
Depending upon the scale of exposure variable, an MR study reports causal effect estimate per unit change in 1SD of continuous variable or log-odds of binary variable. Evidently, majority of hypothesis explored role of continuous exposure variables with nine of the 10 studies expressed causal effect estimates as effect estimate per unit change in the continuous variable. However, we observed scaling of OR in certain instances and changes in certain exposures were further expressed in transformed scale according to transformation of exposure in the source GWAS study. For instance studies reporting effect of smoking and education scaled OR as per the ease of interpretation. Several authors reported effect of smoking quantity, alcohol and length of education as per unit increase in 10 cigarettes per day, drinks of alcohol per week and per year of education respectively (17, 39, 43). On the other hand, biochemical parameters like CRP and vitamin D were expressed per unit change in certain extent of proportion. Prins et al. expressed effect of CRP on PD, AD and PD per 10% increase in CRP levels which is equivalent per unit increase in lnCRP (52). Larsson et al. on the other hand reported effect of Vitamin D on AD per 10% decrease in 25OHD concentration (25). The same author in his latest manuscript further expressed effect of Vitamin D on AD per 20% increase in 25OHD concentration (17). Clearly, such heterogeneity not only requires careful interpretation but also stresses upon the need for a consensus in scaling of effect estimates when reporting results, so as to enable comparison of results across different MR studies.
1.6.3 Use of Replication cohort
We define replication cohort in an MR study as an independent outcome dataset with a similar case definition or phenotypic measurement using an identical genetic instrument as in the discovery cohort. Power of an MR study is not only dependent on the strength of the genetic instrument but also to a large extent on sample size of the outcome dataset and ratio of cases and controls. Although few studies attempted to check sub-population specific causal estimates, however this approach is different from a replication cohort which ideally should be defined at the start of a study taking power issues into consideration.Unlike any observational genetic study, we failed to observe any MR study employing a replication cohort. Considering the fact, large number of MR studies struggle to meet high sample size requirement in the outcome dataset, finding a similar cohort to replicate the MR analysis is still far from reality.
1.6.4 Bi-directionality check
In general, several naturally occurring relationships between risk factors and outcomes are often two-sided, with outcome itself simultaneously triggering an increase in risk factor. Conducting a bidirectional check in such a scenario could not only provide relevant insights into the disease mechanism but also confirm existence of unidirectional relationship only by showing presence of association exclusively in a single direction. Considering the fact that such investigations require the availability of complete summary dataset for outcome and exposure variables, the complete dataset on exposure as well as outcome variable may not be readily available, thereby hindering any further investigation. We observed only single MR analysis that explored the bi-directionality between exposure and outcome. The study by Mokry et al. exploring bidirectional relationship between BMI and MS suggested that genetic determinants of BMI contribute to MS with no complementary influence of genetic determinants of MS on BMI (16). However, such investigations may be hampered by differential power to detect causal effects specifically when exposure and outcome have different scales (e.g. one is categorical and other is continuous).
1.6.5 Stratified analysis
We define stratified analysis as analysis stratified by a phenotypic trait other than exposure, outcome or genotypic instrument. We did not find any study conducting a stratified analysis. The absence of stratified analysis in MR could be existence of different causal pathways from exposure to outcome in different strata (e.g. age and gender) and limited to power to do any sub-group analysis.
1.6.6 Use of positive and negative controls
In addition to strength and ruling out the influential role of pleiotropic variants, the validity of genetic instrument may be further checked by re-confirming its causal (positive) and non-causal role (negative) on unrelated disease outcomes (control). Although the current step could well belong to step on validation of genetic instruments, we prioritize this step for sensitivity analysis as it appears to be post-hoc analysis involving use of MR methods to compute causal estimates. We observed only three studies using control analysis in their datasets. Burgess and Smith et al. in their MR analysis exploring the causal role of lipids on AMD validated the genetic instrument for lipids by demonstrating presence and absence of causal role of lipids on CAD and AD respectively using summary level effect estimates in ethnically similar but independent populations (27). Another recent study exploring causal role of BMI on AD demonstrated causal role of BMI in individuals with T2D in the same population using individual level data (24). Another study exploring causal role of coffee on AD used childhood cognition as negative control assuming that children are unlikely to be exposed to coffee (31). In summary, the concept of positive and negative controls continues to be underutilized. One of the reasons could be difficulty in its implementation in the absence of well-established causal roles of genetic instruments in different outcome datasets. This is in addition to availability of datasets on multiple outcomes.
1.6.7 Survivor bias and simulation
Since majority of MR studies involve outcomes that are the primary reasons of mortality in elderly people. The possibility of bias due to predominant inclusion of individuals surviving up to the time of onset of disease cannot be ruled out. The bias which is also called as survivor bias or truncation bias could violate the basic assumptions of MR (53). A simulation study could help to estimate the influence of survivor bias on causal effect estimate, assuming exposure is not related to the outcome. We found only one study addressing the issue by judging the effect of survival bias on causal effect of BMI on PD through frailty analysis (23). The analysis further concluded effect of survivor bias on the overall negative causal effect estimate of BMI observed with PD. Since neurodegenerative diseases are considered to be the disease of elderly people, efforts to address the issue are still lacking in MR literature.
Summary of clinical findings
It must be emphasized that present article did not intend to provide clinical interpretation of findings as such an analysis would involve a careful dissection of results from observational studies, randomized controlled trials, judging the pleiotropic variants and biological pathways represented by the genetic instruments and phenotypic heterogeneity in defining exposures and outcome. This objective will be dealt elsewhere in near future. Nevertheless, we wish to provide an unbiased summary of clinical findings reported from the researcher’s perspective in the field of MR of neurodegenerative outcome. Clearly, AD has been the most commonly explored neurodegenerative disorder. One of the reasons could be AD being the most prevalent neurodegenerative disorder. Another reason could be easy accessibility to the summary statistics on AD dataset.
Among commonly studied biochemical parameters, LDL cholesterol and plasma homocysteine were observed to be risky for AD. On the other hand, LDL cholesterol showed no causal effect on PD. Other lipids including HDL cholesterol, Total cholesterol and triglycerides, and glycemic traits like fasting insulin, fasting glucose and T2D had no influence on AD. Although systolic blood pressure was shown to be risky for AD, genetically determined CAD and C-reactive protein showed no causal effect. Adult height was further shown to be protective with no role of BMI. On the other hand BMI was shown to be protective against PD but causal against MS with no role on AD. Vitamin D is also one of the most commonly studied biomarkers in MR studies was shown to be protective against MS with no underlying role in PD and AD. And lastly consistent protective role of education in AD was observed using both categorical (completion of education) and continuous (years of education) variables as exposure variables (43).
One of the main objectives of the present systematic review was to study influence of heterogeneity on the reported results in studies. On one hand, genetic instrument for a specific exposure may have been dealt differently when studying different outcomes making comparison of same exposure on different outcome extremely difficult. On the other hand, we also observed several studies using the same set of exposures and outcomes and quite often landing with different conclusions and some with considerable difference in effect estimates. Table lists a summary of studies exploring same hypothesis.
Discussion
The overall objective of the current pilot systematic review was two-folds, firstly, to do a critical appraisal of already existing MR literature to understand heterogeneity in conduct and reporting of MR analysis and, secondly, to provide guidance for designing an MR study by using suitable examples at every stage of MR schematic workflow.Our comprehensive systematic review clearly demonstrates several sources of heterogeneity in conduct and report of MR study that could have major impact on overall conclusion on causal relationships.Pleiotropic variants have always been a hindering block in the field of genetics for application in the clinical setting and continue to be one in the field of MR. Although several pre and post-MR methods are available to check the presence of confounding and pleiotropic variants, they continue to be under-utilized. Our review specifically highlights blatant ignorance of MR assumptions II and III and absence of transparent reporting of power calculations, both of which could mislead clinicians towards false interpretations.
With change in focus from individual level data to summary level data in recent years, several changes in the conduct of MR workflow are noteworthy.MR-Egger and Median weighted method have evolved as most frequently used methods to provide causal estimates in the presence of potential pleiotropic variants. Henceforth, using multiple MR methods has become a routine protocol of MR study design. A multi-hypothesis research question addressing a risk factor or outcome of interest is nowadays frequently pursued in MR studies. Furthermore sensitivity analysis by bifurcation of pathways relevant to risk factor leading to the same outcome could provide more reliable interpretation but lack sufficient power due to reduced variance explained by splitted genetic instruments.
Our systematic review further led us to several important issues that must be kept in mind before clinical interpretation of results. As reliability of conclusion in an MR study is largely dependent on well powered GWAS on exposure, most large scale GWAS involve risk factors that are routinely measured in day to day clinical practice for health checkups. It is quite possible that several potential causal factors may not be readily available due to absence of any large scale GWAS. For example collection of sufficient data on behavioral traits such as substance abuse may be extremely difficult. The advent of UK Biobank and its attempt to link to other electronic health record (EHR) based databases could provide one of the alternatives to overcome the highlighted issue (54). Furthermore, since GWAS datasets are continuously updated, the status of causal associations may change with increasing sample size in exposure and outcome datasets. We further observed that lack of reporting of degree of overlap between individuals in exposure and outcome datasets, which is known to have a major influence on causal effect estimates. Henceforth, we recognize need for creating a database that informs researchers about the overlap of individuals among different consortia which would enable not only proper planning but judging the bias in the results. We have also seen development of several new statistical methodologies such as GSMR (Generalised summary based Mendelian randomization), MR-PRESSO (Mendelian randomization pleiotropy residual sum and outlier), LCV (latent cause variable) methods to handle the issue of pleiotropic variants by reducing or eliminating correlation from causation (3, 55, 56). These methodologies further report further claim high false positive rate among methods like IVW and MR-Egger. Hence, there is a need for revisiting previously reported associations in the light of latest MR methods and overlap between latest updated GWAS datasets.We have further seen several reports independently reporting the causal estimates using the same exposure and outcome datasets. It is quite possible that the manuscripts arrive at different conclusions. The issue becomes more critical when there are small number of SNPs explaining the variance in exposure as we demonstrated in our examples with vitamin D, coffee and urate. Furthermore, comparison of causality using same genetic instruments for different outcomes in different manuscripts becomes more difficult to compare. Hence, there is a need for central registration of MR protocols on the line of PROSPERO protocol. The journal publishing the results may further be open to debates or letters to allow for correction interpretation of the results. A recent approach is this direction has been the conduct of Phenome-wide MR which may have its strong and weak points (57). And lastly, we observed cherry-picking of specific exposures to observe causality in the absence of adequate pleiotropic checks a rampant phenomenon. For instance an author may report BMI, lipids and glycemic traits as three independent findings in different publications without checking the overlap between the genetic instruments between highly correlated phenotypic traits. We recommend use of a systematic approach to define a biological hypothesis taking into consideration all the related exposures that could influence the outcome.
Despite being comprehensive in nature focusing on every aspect of MR design; our systematic review has its own share of limitations. Firstly, we focused on a small subset of MR studies restricted to specific field of clinical research. With more than 1000 MR articles published to date, the possibility of deviations in trends observed in the present article cannot be ruled out. Nevertheless, our study identified several sources of potential bias in the conduct and report of MR study. Several pre-print servers such as BioRxiv are now predominantly used for publishing of non-peer reviewed novel findings in the field of genetics. Although we are in support of such a platform as it avoids duplicate publications and provides timely directions to other readers, we did not use BioRxiv or similar non-reviewed literature disclosed in recent conferences as a reviewer could have major influence on method and conduct of MR workflow irrespective of the outcome of the study. We further observed a similarity in MR workflow specifically in the conduct of sensitivity analysis by publications originating from the same group. However, we did not perform any stratified analysis to see the influence of such publications on the overall trends. And lastly, since neurodegenerative disorders are often associated with old age, several other related phenotypic outcomes could not be considered in the current systematic review. For example we did not include studies exploring cognition in general population specifically in a subgroup of old aged individuals (58, 59).
In summary, we hope that our systematic review could act as a cautionary document promoting judicious conduct and transparent reporting of MR workflow. Our workflow could not only provide a detailed guide for MR beginners but also enables researcher to do critical appraisal of existing literature. We further wish to expand our review to all the existing MR articles which could provide a useful aid in drug discovery and development. And lastly, we hope to evolve consensus for developing MR reporting guidelines among the research community that could enable effective utilization of public funds for future MR related projects.
References
1. Didelez V, Sheehan N. Mendelian randomization as an instrumental variable approach to causal inference. Statistical methods in medical research. 2007;16(4):309-30.
2. Visscher PM, Wray NR, Zhang Q, Sklar P, McCarthy MI, Brown MA, et al. 10 Years of GWAS Discovery: Biology, Function, and Translation. American journal of human genetics. 2017;101(1):5-22.
3. Verbanck M, Chen CY, Neale B, Do R. Detection of widespread horizontal pleiotropy in causal relationships inferred from Mendelian randomization between complex traits and diseases. Nature genetics. 2018;50(5):693-8.
4. Evangelou E, Ioannidis JP. Meta-analysis methods for genome-wide association studies and beyond. Nat Rev Genet. 2013;14(6):379-89.
5. Burgess S, Scott RA, Timpson NJ, Davey Smith G, Thompson SG. Using published data in Mendelian randomization: a blueprint for efficient identification of causal risk factors. European journal of epidemiology. 2015;30(7):543-52.
6. Bowden J, Davey Smith G, Haycock PC, Burgess S. Consistent Estimation in Mendelian Randomization with Some Invalid Instruments Using a Weighted Median Estimator. Genetic epidemiology. 2016;40(4):304-14.
7. Greco MF, Minelli C, Sheehan NA, Thompson JR. Detecting pleiotropy in Mendelian randomisation studies with summary data and a continuous outcome. Stat Med. 2015;34(21):2926-40.
8. Boef AG, Dekkers OM, le Cessie S. Mendelian randomization studies: a review of the approaches used and the quality of reporting. International journal of epidemiology. 2015;44(2):496-511.
9. Grover S, Del Greco MF, Stein CM, Ziegler A. Mendelian Randomization. Methods in molecular biology (Clifton, NJ). 2017;1666:581-628.
10. Moher D, Liberati A, Tetzlaff J, Altman DG, Group P. Preferred reporting items for systematic reviews and meta-analyses: the PRISMA statement. PLoS medicine. 2009;6(7):e1000097.
11. Grover S, Del Greco MF, Konig IR. Evaluating the current state of Mendelian randomization studies: a protocol for a systematic review on methodological and clinical aspects using neurodegenerative disorders as outcome. Syst Rev. 2018;7(1):145.
12. Larsson SC, Traylor M, Burgess S, Markus HS. Genetically-Predicted Adult Height and Alzheimer’s Disease. Journal of Alzheimer’s disease : JAD. 2017;60(2):691-8.
13. Williams DM, Karlsson IK, Pedersen NL, Hagg S. Circulating insulin-like growth factors and Alzheimer disease: A mendelian randomization study. Neurology. 2018;90(4):e291-e7.
14. Roostaei T, Felsky D, Nazeri A, De Jager PL, Schneider JA, Bennett DA, et al. Genetic influence of plasma homocysteine on Alzheimer’s disease. Neurobiology of aging. 2018;62:243 e7- e14.
15. Policicchio S, Ahmad AN, Powell JF, Proitsi P. Rheumatoid arthritis and risk for Alzheimer’s disease: a systematic review and meta-analysis and a Mendelian Randomization study. Scientific reports. 2017;7(1):12861.
16. Mokry LE, Ross S, Timpson NJ, Sawcer S, Davey Smith G, Richards JB. Obesity and Multiple Sclerosis: A Mendelian Randomization Study. PLoS medicine. 2016;13(6):e1002053.
17. Larsson SC, Traylor M, Malik R, Dichgans M, Burgess S, Markus HS, et al. Modifiable pathways in Alzheimer’s disease: Mendelian randomisation analysis. BMJ (Clinical research ed). 2017;359:j5375.
18. Larsson SC, Markus HS. Branched-chain amino acids and Alzheimer’s disease: a Mendelian randomization analysis. Scientific reports. 2017;7(1):13604.
19. Kunutsor SK, Laukkanen JA, Burgess S. Genetically elevated gamma-glutamyltransferase and Alzheimer’s disease. Experimental gerontology. 2018;106:61-6.
20. Grace C, Clarke R, Goel A, Farrall M, Watkins H, Hopewell JC. Lack of genetic support for shared aetiology of Coronary Artery Disease and Late-onset Alzheimer’s disease. Scientific reports. 2018;8(1):7102.
21. Rasmussen KL, Tybjaerg-Hansen A, Nordestgaard BG, Frikke-Schmidt R. Plasma apolipoprotein E levels and risk of dementia: A Mendelian randomization study of 106,562 individuals. Alzheimers Dement. 2018;14(1):71-80.
22. Wu SP, Ma JJ, Qi YW, Zhang JW. Plasma homocysteine levels and risk of vascular dementia: A Mendelian randomization study Int J Clin Exp Med. 2017;10(6):10.
23. Noyce AJ, Kia DA, Hemani G, Nicolas A, Price TR, De Pablo-Fernandez E, et al. Estimating the causal influence of body mass index on risk of Parkinson disease: A Mendelian randomisation study. PLoS medicine. 2017;14(6):e1002314.
24. Nordestgaard LT, Tybjaerg-Hansen A, Nordestgaard BG, Frikke-Schmidt R. Body Mass Index and Risk of Alzheimer’s Disease: A Mendelian Randomization Study of 399,536 Individuals. The Journal of clinical endocrinology and metabolism. 2017;102(7):2310-20.
25. Larsson SC, Singleton AB, Nalls MA, Richards JB, International Parkinson’s Disease Genomics C. No clear support for a role for vitamin D in Parkinson’s disease: A Mendelian randomization study. Movement disorders : official journal of the Movement Disorder Society. 2017;32(8):1249-52.
26. Romo ML, Schooling CM. Examining the Causal Role of Leptin in Alzheimer Disease: A Mendelian Randomization Study. Neuroendocrinology. 2017;105(2):182-8.
27. Burgess S, Davey Smith G. Mendelian Randomization Implicates High-Density Lipoprotein Cholesterol-Associated Mechanisms in Etiology of Age-Related Macular Degeneration. Ophthalmology. 2017;124(8):1165-74.
28. Benn M, Nordestgaard BG, Frikke-Schmidt R, Tybjaerg-Hansen A. Low LDL cholesterol, PCSK9 and HMGCR genetic variation, and risk of Alzheimer’s disease and Parkinson’s disease: Mendelian randomisation study. BMJ. 2017;357:j1648.
29. Devorak J, Mokry LE, Morris JA, Forgetta V, Davey Smith G, Sawcer S, et al. Large differences in adiponectin levels have no clear effect on multiple sclerosis risk: A Mendelian randomization study. Multiple sclerosis (Houndmills, Basingstoke, England). 2016:1352458516681196.
30. Cruchaga C, Kauwe JS, Nowotny P, Bales K, Pickering EH, Mayo K, et al. Cerebrospinal fluid APOE levels: an endophenotype for genetic studies for Alzheimer’s disease. Human molecular genetics. 2012;21(20):4558-71.
31. Kwok MK, Leung GM, Schooling CM. Habitual coffee consumption and risk of type 2 diabetes, ischemic heart disease, depression and Alzheimer’s disease: a Mendelian randomization study. Scientific reports. 2016;6:36500.
32. Gianfrancesco MA, Glymour MM, Walter S, Rhead B, Shao X, Shen L, et al. Causal Effect of Genetic Variants Associated With Body Mass Index on Multiple Sclerosis Susceptibility. American journal of epidemiology. 2017.
33. Rhead B, Baarnhielm M, Gianfrancesco M, Mok A, Shao X, Quach H, et al. Mendelian randomization shows a causal effect of low vitamin D on multiple sclerosis risk. Neurology Genetics. 2016;2(5):e97.
34. Mokry LE, Ross S, Ahmad OS, Forgetta V, Smith GD, Goltzman D, et al. Vitamin D and Risk of Multiple Sclerosis: A Mendelian Randomization Study. PLoS medicine. 2015;12(8):e1001866.
35. Hu Q, Teng W, Li J, Hao F, Wang N. Homocysteine and Alzheimer’s Disease: Evidence for a Causal Link from Mendelian Randomization. Journal of Alzheimer’s disease : JAD. 2016;52(2):747-56.
36. Gianfrancesco MA, Stridh P, Rhead B, Shao X, Xu E, Graves JS, et al. Evidence for a causal relationship between low vitamin D, high BMI, and pediatric-onset MS. Neurology. 2017;88(17):1623-9.
37. Simon KC, Eberly S, Gao X, Oakes D, Tanner CM, Shoulson I, et al. Mendelian randomization of serum urate and parkinson disease progression. Annals of neurology. 2014;76(6):862-8.
38. Nguyen TT, Tchetgen Tchetgen EJ, Kawachi I, Gilman SE, Walter S, Liu SY, et al. Instrumental variable approaches to identifying the causal effect of educational attainment on dementia risk. Annals of epidemiology. 2016;26(1):71-6.e1-3.
39. Prins BP, Abbasi A, Wong A, Vaez A, Nolte I, Franceschini N, et al. Investigating the Causal Relationship of C-Reactive Protein with 32 Complex Somatic and Psychiatric Outcomes: A Large-Scale Cross-Consortium Mendelian Randomization Study. PLoS medicine. 2016;13(6):e1001976.
40. Proitsi P, Lupton MK, Velayudhan L, Newhouse S, Fogh I, Tsolaki M, et al. Genetic predisposition to increased blood cholesterol and triglyceride lipid levels and risk of Alzheimer disease: a Mendelian randomization analysis. PLoS medicine. 2014;11(9):e1001713.
41. Zhan Y, Song C, Karlsson R, Tillander A, Reynolds CA, Pedersen NL, et al. Telomere Length Shortening and Alzheimer Disease–A Mendelian Randomization Study. JAMA neurology. 2015;72(10):1202-3.
42. Pichler I, Del Greco MF, Gogele M, Lill CM, Bertram L, Do CB, et al. Serum iron levels and the risk of Parkinson disease: a Mendelian randomization study. PLoS medicine. 2013;10(6):e1001462.
43. Ostergaard SD, Mukherjee S, Sharp SJ, Proitsi P, Lotta LA, Day F, et al. Associations between Potentially Modifiable Risk Factors and Alzheimer Disease: A Mendelian Randomization Study. PLoS medicine. 2015;12(6):e1001841; discussion e.
44. Mukherjee S, Walter S, Kauwe JS, Saykin AJ, Bennett DA, Larson EB, et al. Genetically predicted body mass index and Alzheimer’s disease-related phenotypes in three large samples: Mendelian randomization analyses. Alzheimer’s & dementia : the journal of the Alzheimer’s Association. 2015;11(12):1439-51.
45. Walter S, Marden JR, Kubzansky LD, Mayeda ER, Crane PK, Chang SC, et al. Diabetic Phenotypes and Late-Life Dementia Risk: A Mechanism-specific Mendelian Randomization Study. Alzheimer disease and associated disorders. 2016;30(1):15-20.
46. Mokry LE, Ross S, Morris JA, Manousaki D, Forgetta V, Richards JB. Genetically decreased vitamin D and risk of Alzheimer disease. Neurology. 2016;87(24):2567-74.
47. Hoffmann TJ, Ehret GB, Nandakumar P, Ranatunga D, Schaefer C, Kwok PY, et al. Genome-wide association analyses using electronic health records identify new loci influencing blood pressure variation. Nat Genet. 2017;49(1):54-64.
48. Nalls MA, Pankratz N, Lill CM, Do CB, Hernandez DG, Saad M, et al. Large-scale meta-analysis of genome-wide association data identifies six new risk loci for Parkinson’s disease. Nat Genet. 2014;46(9):989-93.
49. Locke AE, Kahali B, Berndt SI, Justice AE, Pers TH, Day FR, et al. Genetic studies of body mass index yield new insights for obesity biology. Nature. 2015;518(7538):197-206.
50. Speliotes EK, Willer CJ, Berndt SI, Monda KL, Thorleifsson G, Jackson AU, et al. Association analyses of 249,796 individuals reveal 18 new loci associated with body mass index. Nat Genet. 2010;42(11):937-48.
51. Devorak J, Mokry LE, Morris JA, Forgetta V, Davey Smith G, Sawcer S, et al. Large differences in adiponectin levels have no clear effect on multiple sclerosis risk: A Mendelian randomization study. Multiple sclerosis (Houndmills, Basingstoke, England). 2017;23(11):1461-8.
52. Prins BP, Abbasi A, Wong A, Vaez A, Nolte I, Franceschini N, et al. Investigating the Causal Relationship of C-Reactive Protein with 32 Complex Somatic and Psychiatric Outcomes: A Large-Scale Cross-Consortium Mendelian Randomization Study. PLoS medicine. 2016;13(6):e1001976.
53. Vansteelandt S, Dukes O, Martinussen T. Survivor bias in Mendelian randomization analysis. Biostatistics. 2018;19(4):426-43.
54. Bycroft C, Freeman C, Petkova D, Band G, Elliott LT, Sharp K, et al. The UK Biobank resource with deep phenotyping and genomic data. Nature. 2018;562(7726):203-9.
55. O’Connor LJ, Price AL. Distinguishing genetic correlation from causation across 52 diseases and complex traits. Nat Genet. 2018.
56. Zhu Z, Zheng Z, Zhang F, Wu Y, Trzaskowski M, Maier R, et al. Causal associations between risk factors and common diseases inferred from GWAS summary data. Nature communications. 2018;9(1):224.
57. Millard LA, Davies NM, Timpson NJ, Tilling K, Flach PA, Davey Smith G. MR-PheWAS: hypothesis prioritization among potential causal effects of body mass index on many outcomes, using Mendelian randomization. Scientific reports. 2015;5:16645.
58. North TL, Palmer TM, Lewis SJ, Cooper R, Power C, Pattie A, et al. Effect of smoking on physical and cognitive capability in later life: a multicohort study using observational and genetic approaches. BMJ Open. 2015;5(12):e008393.
59. Almeida OP, Hankey GJ, Yeap BB, Golledge J, Flicker L. Alcohol consumption and cognitive impairment in older men: a mendelian randomization study. Neurology. 2014;82(12):1038-44.
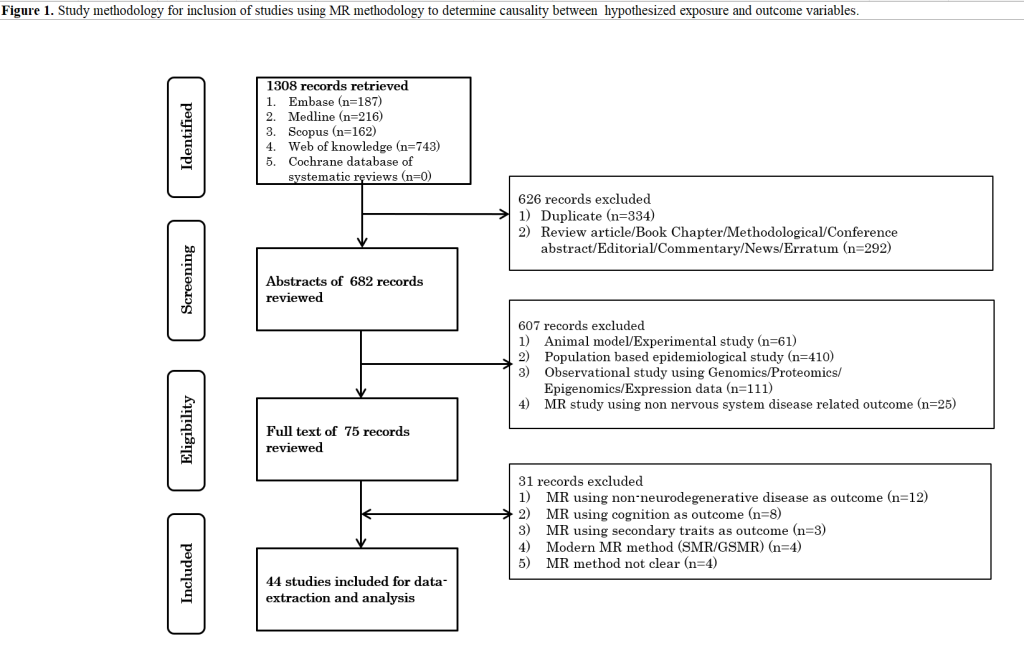
| Table 1. Pre-analysis stages of a Mendelian randomization workflow. | |||
| 1. Stating the hypothesis and idenification of datasets | n (%) | ||
| 1.1 State the hypothesis (exposure-outcome pair) | |||
| A. Number of MR studies | 44 | ||
| B. Number of causal hypothesis | 67 | ||
| C. Total number of main outcomes | 5 | ||
| D. Total number of main exposures | 54 | ||
| E. Studies exploring multiple causal hypothesis | 14 (31.8%) | ||
| Several exposures | 11 (78.6%) | ||
| Several outcomes | 2 (14.3%) | ||
| Several exposures and several outcomes | 1 (7.1%) | ||
| 1.2 Identification of MR datasets (exposure-genetic instrument-outcome triad) | |||
| A. Number of studies employing mulitple MR datasets | 20 (45.5%) | ||
| B. Number of MR datasets | 129 | ||
| C. Main reasons for using multiple MR datasets (for the same casual hypothesis) (MR study based classification; n=44) | |||
| Different source of genetic instruments | 3 (6.8%) | ||
| Different exposure subtypes | 1 (2.3%) | ||
| Different outcome subtypes | 1 (2.3%) | ||
| Different data type (summary/individual) | 4 (9.1%) | ||
| Different population (genetic instrument/ exposure/ outcome) | 1 (2.3%) | ||
| Different ethnicity (genetic instrument/ exposure/ outcome) | 3 (6.8%) | ||
| D. Number of individuals containing data on exposure (Median (range)) | 101069 (550-428235) | ||
| E. Number of individuals containing data on outcome (Median (range)) | 54162 (570-338281) | ||
| F. Number of individuals in an MR dataset (Median (range)) | 131268 (550-482397) | ||
| G. Ethnicity (MR dataset based classification; n=129) | |||
| European/ Majorly European | 121 (93.8%) | ||
| Asian | 8 (6.2%) | ||
| H. Scale of exposure and outcome variables (MR dataset based classification; n=129) | |||
| Binary exposure-binary outcome | 14 (10.9%) | ||
| Continuous exposure-binary outcome | 115 (89.1%) | ||
| I. Risk measure used (MR dataset based classification; n=129) | |||
| Odds ratio | 118 (91.5%) | ||
| Risk ratio | 3 (2.3%) | ||
| Hazards ratio | 6 (4.7%) | ||
| Not available | 2 (1.6%) | ||
| 1.3 MR data and study type (MR dataset based classification; n=129) | |||
| single-sample (individual-level) | 12 (9.3%) | ||
| single-sample (summary-level) | 0 (0.0%) | ||
| separate-sample (invdividual-level) | 5 (3.9%) | ||
| separate-sample (summary-level) | 112 (86.8%) | ||
| Stage 2. Proritization of genetic instrument/s | n (%) | ||
| 2.1 Extracting genetic instrument | |||
| A. Number of individuals in the source datasets (Median (range)) | 111194 (570-556968) | ||
| B. Ethnicity of source datasets (MR dataset based classification; n=129) | |||
| European/ Majorly European | 122 (94.6%) | ||
| Asian | 7 (5.4%) | ||
| C. Criteria for selecting genetic instrument (MR dataset based classification; n=129) | |||
| GWA/GWA meta-analysis | |||
| p<5 x 10⁻⁹ | 2 (1.6%) | ||
| p<2.2 x 10⁻⁹ | 2 (1.6%) | ||
| p<5 x 10⁻⁸ | 96 (74.4%) | ||
| p<5 x 10⁻⁸/5 x 10-7 | 1 (0.8%) | ||
| p<2.5 x10⁻⁷ | 1 (0.8%) | ||
| p<2 x 10⁻⁶ | 3 (2.3%) | ||
| p<5 x 10⁻⁵ | 3 (2.3%) | ||
| p<5 x 10⁻² | 1 (0.8%) | ||
| GWA meta-analysis (log10Bayes-factor>5.64) | 2 (1.6%) | ||
| Functional hypothesis with estimates from GWAS/GWA meta-analysis | 14 (10.9%) | ||
| Functional hypothesis with estimates from meta-analysis of candidate gene studies | 1 (0.8%) | ||
| Functional hypothesis with estimates from candidate gene studies | 3 (2.3%) | ||
| D. GWAS cohorts employed for prioritization of SNPs from source GWAS study (MR dataset based classification; n=129) | |||
| Discovery | 69 (53.5%) | ||
| Discovery and replication | 12 (9.3%) | ||
| Discovery or replication | 3 (2.3%) | ||
| Combined | 28 (21.7%) | ||
| Discovery and/or replication and/or combined | 1 (0.8%) | ||
| Discovery or replication or combined | 2 (1.6%) | ||
| Discovery or combined | 2 (1.6%) | ||
| Discovery and/or replication and/or secondary analyses | 1 (0.8%) | ||
| Not clear/Not applicable | 11 (8.5%) | ||
| 2.2. Harmonizing genetic variants across exposure and outcome dataset | |||
| A. Effect of genetic instrument on exposure (MR dataset based classification; n=129) | |||
| Decrease in exposure levels | 15 (11.6%) | ||
| Increase in exposure levels | 114 (88.4%) | ||
| B. Reporting of use of proxy variants (MR dataset based classification; n=129) | |||
| Reporting of proxy SNPs (methodology/table) | 86 (66.7%) | ||
| Did not use proxy SNP | 56 (43.4%) | ||
| Use of proxy SNP | 30 (23.3%) | ||
| Average number of proxy SNPs (Median (range)) | 4 (1-36) | ||
| Not clear/ Not applicable | 43 (33.3%) | ||
| C. Checked LD between variants of the instrument (MR dataset based classification; n=129) | |||
| Yes | 93 (72.1%) | ||
| Not clear | 36 (27.9%) | ||
| D. Number of SNPs in the finalized genetic instrument (MR dataset based classification; n=129) (Median (range)) | 30 (1-682) | ||
| 2.3 Power calculation (MR dataset based classification; n=129) | |||
| Yes | 43 (33.3%) | ||
| No | 86 (66.7%) | ||
| 2.4 Calulating a genetic risk score using individual level data (MR dataset based classification; n=17) | |||
| Weighted | 10 (58.8%) | ||
| Unweighted | 1 (5.9%) | ||
| Both | 6 (35.3%) | ||
| Stage 3. Validation of the genetic instrument | n (%) | ||
| 3.1 Strength of genetic instrument | |||
| A. Reporting of pooled F-statistics (MR dataset based classification; n=129) | |||
| Yes | 60 (46.5%) | ||
| median (range) | 132.02 (5.7-8305) | ||
| 3.2 Existence of pleiotropic pathways (MR study based classification; n=44) | |||
| A. Association analysis of single/ pooled genetic instruments with confounders (Use of internal dataset or literature) | |||
| Yes | 21 (47.7%) | ||
| B. Association analysis of single/ pooled genetic instrument directly with outcome (Use of MR dataset or literature) | |||
| Yes | 3 (6.8%) | ||
| Table 2. Analysis stages of a Mendelian randomization workflow. | ||
| Stage 4. Estimation of causal estimate | n (%) | |
| A. Individual level data (MR dataset based classification; n=17) | ||
| Two-stage least squares (TSLS) | 13 (76.5) | |
| Control function estimator (CFE) | 1 (5.9) | |
| Generalized methods of moments (GMM) | 2 (11.8) | |
| Sructural mean model (SMM) | 1 (5.9) | |
| B. Summary level data (MR dataset based classification; n=112) | ||
| Single method | ||
| Ratio | 5 (4.5) | |
| Inverse variance weighted (IVW)* | 33 (29.5) | |
| maximum likelihood (ML) | 1 (0.9) | |
| Weighted GLM | 1 (0.9) | |
| Multiple methods | ||
| IVW, MR-Egger | 8 (7.1) | |
| IVW, ML | 1 (0.9) | |
| IVW, weighted median (WM) | 3 (2.7) | |
| IVW, Multivariable MR (MVMR) | 8 (7.1) | |
| IVW, penalized weighted median (PWM), MR-Egger | 1 (0.9) | |
| IVW, WM, MR-Egger | 14 (12.5) | |
| IVW, WM, PWM, MR-egger | 25 (22.3) | |
| IVW, WM, Weighted mode (WMo), MR-Egger, ML | 1 (0.9) | |
| IVW, simple median (SM), WM, MR-Egger | 1 (0.9) | |
| IVW, WM, MR-Egger, Robust MR-Egger | 1 (0.9) | |
| IVW, WM, MVMR, MR-Egger | 7 (6.3) | |
| MVMR, MR-Egger | 2 (1.8) | |
| Stage 5. Checking the heterogeneity or pleiotropy among genetic instruments | n (%) | |
| 5.1 Statistical parameter based methods | ||
| A. Individual level data (MR dataset based classification; n=17) | ||
| No method reported | 17 (100.0) | |
| B. Summary level data (MR dataset based classification; n=112) | ||
| Single method | ||
| Cochran Q-statistic | 4 (3.6) | |
| I-square statistic | 4 (3.6) | |
| MR Eggers intercept test | 35 (31.3) | |
| Multiple methods | ||
| Cochran Q-statistic, I-square statistic | 8 (7.1) | |
| Cochran Q-statistic, MR-Egger’s intercept test | 4 (3.6) | |
| Cochran Q-statistic, I-square statistic, MR-Egger’s intercept test | 5 (4.5) | |
| I-square statistic, MR-Egger’s intercept test | 6 (5.4) | |
| No method reported | 46 (41.1) | |
| 5.2 Graphical based method (MR study based classification; n=44) | ||
| A. Funnel or scatter or forest | 33 (75.0) | |
| Scatter plot (exposure effect estimate vs. outcome effect estimate) | 8 (18.2) | |
| Funnel plot (Individual SNP level causal effect estimates vs. corresponding inverse of standard error estimates) | 1 (2.3) | |
| Forest plot (Individual SNP level causal effect estimates) | 11 (25.0) | |
| Scatter plot and Forest plot | 4 (9.1) | |
| Scatter plot and Funnel plot | 3 (6.8) | |
| Funnel and scatter and forest | 6 (13.6) | |
| No plot reported | 11 (25.0) | |
| Table 3. Post-analysis stages of a Mendelian randomization workflow. | ||
| Stage 6. Sensitivity analysis | n (%) | |
| 6.1 Use of different methods (MR dataset based classification; n=129) | ||
| Multiple MR methods | 72 (55.8) | |
| Different genetic risk scores (individual level data) | 6 (4.7) | |
| Observational and causal estimates | 21 (16.3) | |
| Iindividal and summary level estimates | 8 (6.2) | |
| Regression models adjusted for different variables | 9 (7.0) | |
| 6.2 Use of different genetic instruments (MR dataset based classification; n=129) | ||
| Unique loci across multiple expsoures | 13 (10.1) | |
| Leave one SNP out | 62 (48.1) | |
| Grouping of variants into functional categories | 16 (12.4) | |
| Exclusion of SNPs associated with potential confounders | 8 (6.2) | |
| Exclusion of SNPs associated with outcome | 8 (6.2) | |
| Exclusion of SNPs not associated with outcome | 2 (1.6) | |
| Exclusion of SNPs associated with exposure | 1 (0.8) | |
| Exclusion of outlier SNPs | 15 (11.6) | |
| Exclusion of SNPs using Iteration based approach | 2 (1.6) | |
| Exclusion of proxy SNPs | 2 (1.6) | |
| Exclusion of SNPs influenced by population stratification | 4 (3.1) | |
| 6.3 Use of different sub-grouping of individuals (MR dataset based classification; n=129) | ||
| Different sub-populations | 9 (7.0) | |
| Secondary definitons of the same outcome | 7 (5.4) | |
| Stage 7. Additional analysis or reporting | n (%) | |
| 7.1 Applied multiple corrections (MR study based classification; n=44) | ||
| Yes | Yes | 12 (27.3) |
| No | No | 10 (22.7) |
| Not applicable (No association) | Not applicable (No association) | 4 (9.1) |
| Not applicable (single MR dataset in the study) | Not applicable (Single MR dataset in the study) | 18 (40.9) |
| 7.2 Reporting of units of effect estimates using continuous exposure (MR study based classifcation; n=44) | ||
| per unit change in standard deviation (e.g. OR per increase in 1SD; OR per 1SD increase in transformed exposure) | OR per unit change in standard deviation (e.g. OR per unit increase in SD in exposure; OR per unit increase in SD in transformed exposure) | 10 (22.7) |
| per unit change with real scale and units (e.g. OR per increase in 5kg/m2; OR per increase in 10% conc) | OR per unit change in real scale and units (e.g. OR per unit increase in 5kg/m2 of exposure; OR per unit increase in 10% conc. of exposure) | 25 (56.8) |
| per unit change in standard devaition/ per unit change in real scale and units | OR per unit change in standard deviation or OR per unit change in real scale and units | 1 (2.3) |
| no units expressed (e.g. OR or beta) | no units expressed (OR or effect estimates as β) | 6 (13.6) |
| per unit change in log odds (e.g. binary exposure variable) | per unit change in log-odds of binary exposure | 2 (4.5) |
| 7.3 Use of replication cohort (MR dataset based classification; n=129) | ||
| Yes | Yes | 3 (2.3) |
| 7.4 Bidirectionality check (MR dataset based classification; n=129) | ||
| Yes | Yes | 3 (2.3) |
| 7.5 Stratified analysis (MR dataset based classification; n=129) | ||
| Yes | Yes | 4 (3.1) |
| 7.6 Use of postive and negative controls (MR dataset based classification; n=129) | ||
| Yes | Yes | 9 (7.0) |
| 7.7 Survival bias and simulation (MR dataset based classification; n=129) | ||
| Yes | Yes | 1 (0.8) |
© Sandeep Grover 25.03.2019. All rights reserved.
Leave a Reply